Few days back, a new report popped up on the Graph API changelog page and under the /beta documentation page, namely the SharePoint API Usage report. At the time, the endpoint returned a 403 Forbidden error with the “Tenant {tenantId} is not enabled for this preview feature.” message, much like the one shown in Example 10 of the documentation, or the screen below, so I figured I’d add it to my “to do” list and cover it later.
 Well, it seems the day has now come, as I can get the corresponding data within my tenant. Before we talk about what can be gained from working with the new report, we need to mention another novelty. Namely, the report must be enabled first, via the newly introduced apiUsageReportMetrics report settings control. Only after you have enable data collection within your tenant can you expect the report to expose actual usage data. Until that happens, you will run into another 403 Forbidden error, as shown below:
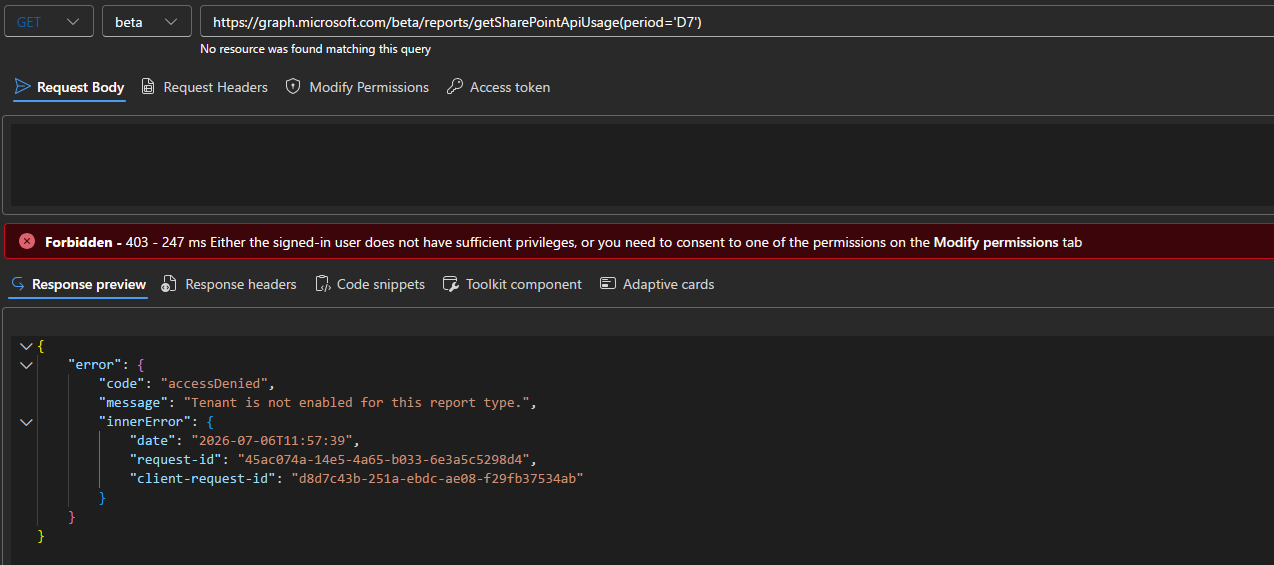 How to enable the SharePoint API usage report metric
So first things first, you need to toggle the data collection for this report via the enableApiUsageReport endpoint. To toggle it you will need an admin account and an application with the ReportSettings.ReadWrite.All delegate permission added. There is no support currently for application permissions, according to the documentation. Then again, the endpoints do not seem to actually enforce the required permissions currently, and I was able to toggle them via a Global administrator with just the Reports.Read.All scope granted in Graph explorer. Nevertheless, make sure you follow the official documentation on this.
To enable data collection for the SharePoint API usage report, issue a POST request against the enableApiUsageReport endpoint and provide the following payload:
POST https://graph.microsoft.com/beta/admin/reportSettings/sharePoint/enableApiUsageReport

{
  "metric": "EgressReport"
}
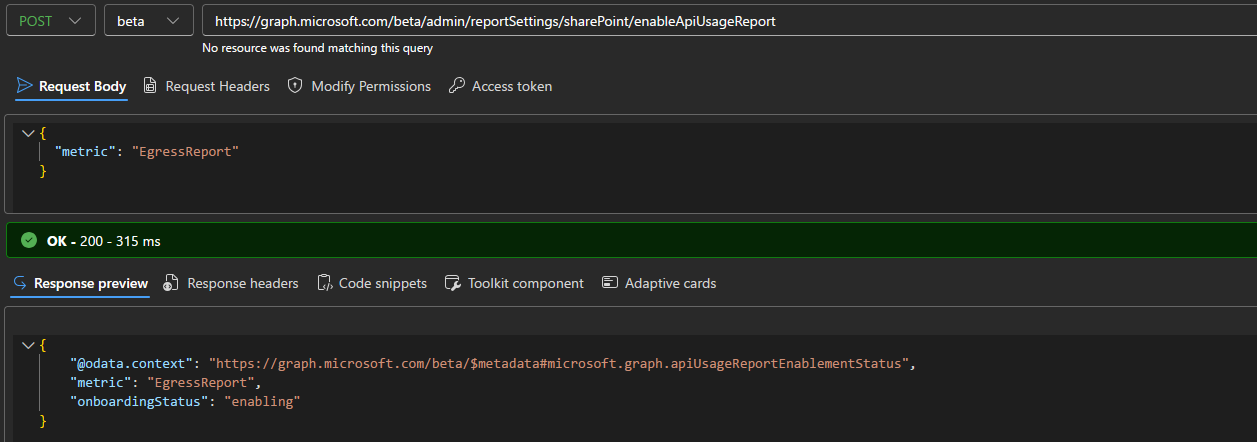 Successful execution will result in a 200 OK response, with the onboardingStatus returned as enabling.
To verify the status, use a GET request against the /admin/reportSettings/sharePoint/apiUsageReportMetrics endpoint:
GET https://graph.microsoft.com/beta/admin/reportSettings/sharePoint/apiUsageReportMetrics
Funnily enough, the GET method does not seem to enforce the corresponding ReportSettings.Read.All permission either 🙂
Working with the SharePoint API usage report
Once you have enabled data collection for the SharePoint API usage report and sufficient time has passed, the corresponding usage data will be exposed under the /beta/reports/getSharePointApiUsage endpoint. My recommendation is to give it few days, as the report data is generated on a per-day basis anyway. Until the data has become available, expect to see 403 errors such as the ones shown in the previous sections.
Permission-wise, you will need the “standard” Reports.Read.All scope, and a user account with sufficient permissions (for example the Reports reader role). Again, only delegate permissions are supported. Keep in mind that the report is currently in preview and is only available under the /beta endpoint, so your requests should be crafter accordingly.
To get the report data for the past 30 days, use the following query:
GET https://graph.microsoft.com/beta/reports/getSharePointApiUsage(period='D30')
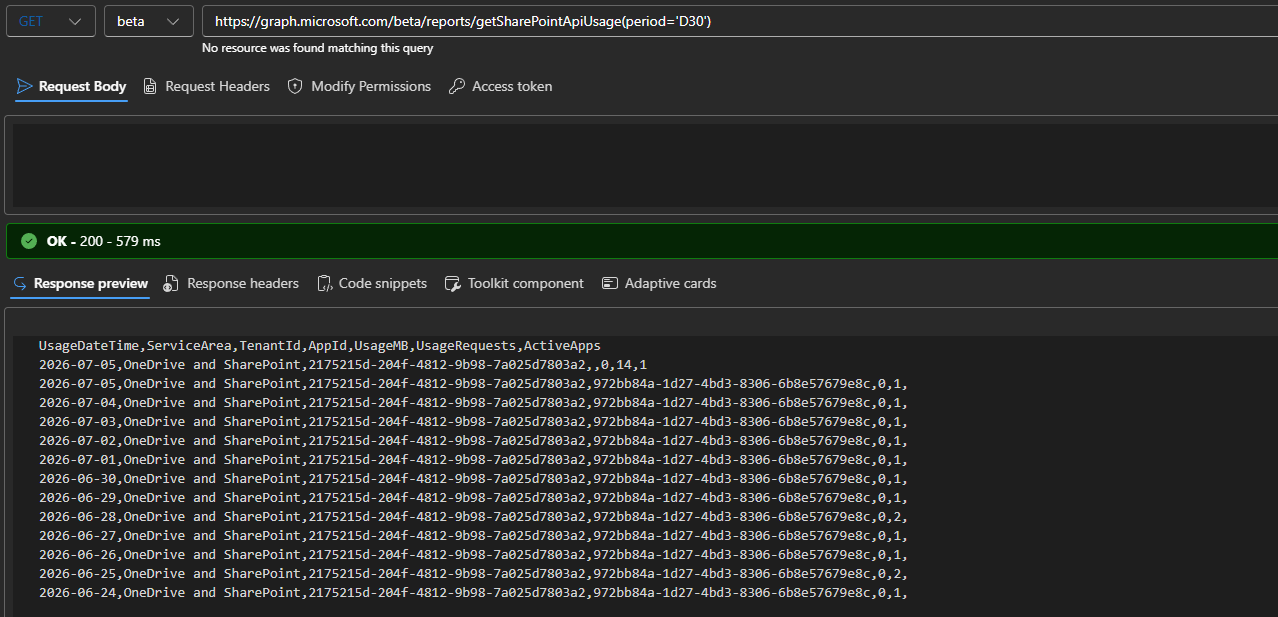
As you can see from the screenshot above, the output closely resembles the output of the Graph API usage report we covered previously. The following columns are currently exposed:
- UsageDateTime – the date for which the current report entry is, one per day.
- ServiceArea – the service, one of the four listed above.
- TenantId – GUID of the tenant… which only adds noise IMO.
- AppId – GUID for the application, each app should have its own entry per day.
- UsageMB – amount of data (in MB) used by the API operations performed by a given app for the day.
- UsageRequests – count of the API operations performed by a given app for the day.
- ActiveApps – this field is listed in the documentation, but not currently returned. It seems to indicate the count of unique apps with activity for the day and will likely only be available on the “cumulative” entries.
Again similar to the Graph API usage report, the following set of query parameters is supported:
- appId – filter the report by specific AppID value, for example appId=’972bb84a-1d27-4bd3-8306-6b8e57679e8c′ (corresponding to Microsoft Defender for Cloud Apps – APIs).
- period – get the report data for specific time period. Unlike other report endpoints, only the following values are currently supported: D1, D7, D30. For example: period=’D30′.
- date – get the report data for specific dates, in YYYY-MM-DD format. For example: date=2026-02-04.
The report also supports the $format parameter, which controls the output format. Default is JSON, and you should not use any other value. For additional information and examples, make sure to check the official documentation.
Summary
In summary, we now have the SharePoint API usage metric report available, which gives us the same data as the Graph API usage report does, but for the SPO service. Why Microsoft needed a separate endpoint for this is beyond me, and same goes for the requirement to first enable data collection for the report. Just another example that the Graph is a “loosely coupled” collection of endpoints, with every team within Microsoft doing their own thing and ignoring any idea of uniformity.
In addition, it has been over an year since we got the Graph API usage reports, and we haven’t heard a thing from Microsoft regarding their plans. Are they going to enforce a new form of throttling controls or will the reports be simply informative? A question nobody seems to be interested in answering at this point.
Anyway, having more reports is always a good thing in my book, so I’m doing my part in spreading the word.
1 thought on “First look at the SharePoint API usage report”