Earlier this month, we covered the newly introduced SharePoint Online API usage report. As part of our initial view of said report, we pondered as to why Microsoft decided to introduce a separate endpoint for it, instead of bundling it as part of the existing Graph API usage one. The need to first enable data collection was also a novelty, and something we haven’t seen for any of the existing usage reports surfaced via the Graph API.
Well, it turns out that Microsoft did have further plans along this path, as evident by the newly introduced SharePoint Online throttling report, which we will cover in this article. As the name of the report suggests, the SPO throttling report can be used to obtain some throttling-related datapoints. Every customer using the APIs to perform bulk operations against SPO sites or items will attest to the need for such analytics, so let’s take a look.
First things first, much like the SPO API usage report, we need to enable data collection for the SPO throttling report. This is done by issuing a POST request against the /admin/reportSettings/sharePoint/enableApiUsageReport endpoint, as shown in the example below. Once data collection has been enabled, you will be able to use the /reports/getSharePointApiUsage endpoint to fetch the throttling data.
To provide some sort of a story around this however, let’s start with the error message you will get if the report has not been enabled. The screenshot below illustrates what the experience will look like in this scenario. The 403 Forbidden error can be a bit misleading, as permissions are not the issue here. Luckily, the Tenant is not enabled for this report type message is clear enough and tells us what the problem is.
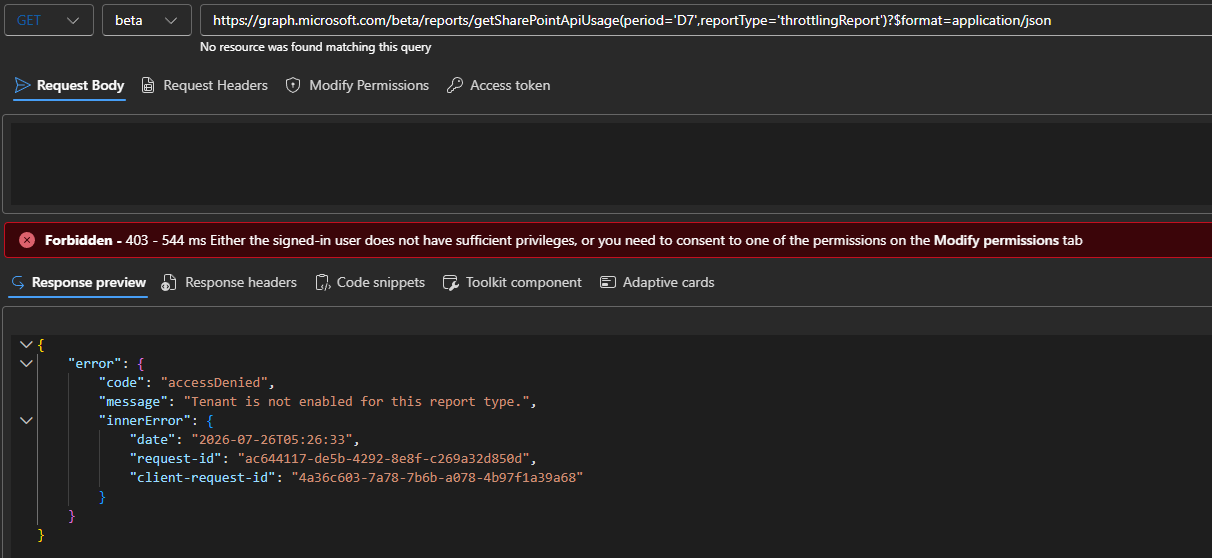
To remedy the above, we need to use the enableApiUsageReport method and provide the report name as the payload. Here is an example of how to do that (make sure you have ReportSettings.ReadWrite.All permissions):
POST https://graph.microsoft.com/beta/admin/reportSettings/sharePoint/enableApiUsageReport

{
  "metric": "throttlingReport"
}
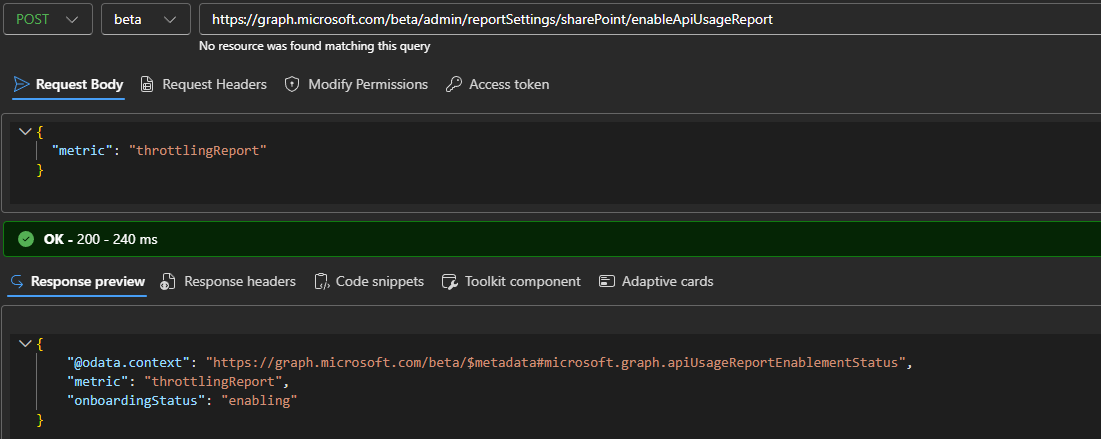
A 200 OK response indicates successful execution, at which point the status of the report is changed to Enabling. It will take few hours before data becomes available (the value of onboardingStatus will change to enabled), and you can leverage the /admin/reportSettings/sharePoint/apiUsageReportMetrics endpoint to check the status:
GET https://graph.microsoft.com/beta/admin/reportSettings/sharePoint/apiUsageReportMetrics
Once sufficient time has passed, you can query the report itself. The permissions you’ll need are Reports.Read.All, though only the delegate permissions flavor is currently supported. The endpoint is /reports/getSharePointApiUsage, and you will also need to specify the reportType value of throttlingReport in addition to the date/period selection. Here’s how a request looks like:
GET https://graph.microsoft.com/beta/reports/getSharePointApiUsage(period='D7',reportType='throttlingReport')?$format=application/json
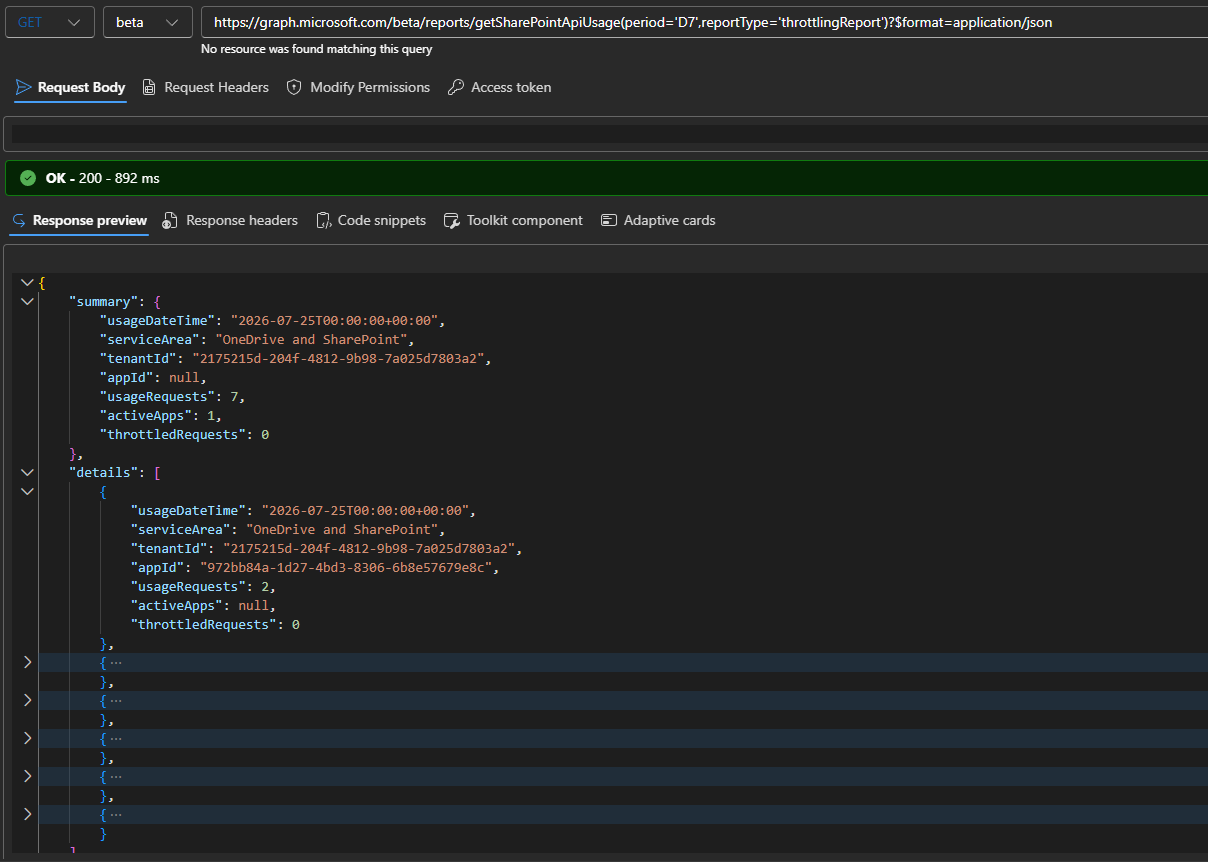
Note: if you do not specify a value for the reportType parameter, the SPO API Usage report (‘egressReport‘) data will be returned instead. Apart from it, you need to specify either a period or date value, and optionally, appId to filter against. As for the standard query parameters, $skip, $top and $format are supported, with the latter allowing you to choose between CSV and JSON output for the report data.
The screenshot above illustrates the SPO Throttling report output. As you can see, the output is composed of two parts, one giving you the summary and another one giving per-application per-day details, with both using the same schema. When an appId was provided, the summary facet will be empty.
The following set of properties (columns) are exposed as part of the report:
- UsageDateTime – which day the data was generated for. Within the summary facet, it gives you the date the report was generated on.
- ServiceArea – should always have the “OneDrive and SharePoint” value.
- TenantId – the GUID of the tenant for which the report was generated for (Note: this is the GUID of the root SPO site, not the Entra ID tenant GUID).
- AppId – the GUID of the application for which data is shown. This value will be empty when returned in the summary facet.
- UsageRequests – the number of request for the given app and date. Total count is returned as part of the summary facet.
- ActiveApps – the number of active apps for the date/period covered by the report. Will be empty when returned as part of the details facet.
- ThrottledRequests – the number of throttled request for the given app and date. Cumulative value is returned as part of the summary facet.
If requesting output as CSV file, the first row will give the summary and subsequent rows the per-app per-date details. Note: unlike all other Graph API reports, the content of the resulting CSV file is returned as output, not a redirect link to download the file. You’d probably want to stick to JSON output anyway, as it is the format that supports all query parameters (neither $top nor $skip will work for the CSV output).
While the data shown above for my own tenant doesn’t reveal anything interesting, organizations and ISV heavily invested in SharePoint Online will undoubtedly appreciate this new report. For additional details and more examples, check the official documentation.
P.S. Forgot to mention the SPO throttling report does not currently enforce the “advertised” Reports.Read.All permission, that is you can fetch the data via any client that supports querying the Graph API, as long as the user (delegate) account has sufficient permissions to read reports.