As Microsoft 365 enters its teen years, some maturity starts to set in (pun totally intended). These days, there is a lot less talk of migration, adoption, or even new features, and more focus on governance, security, automation. It’s not that scenarios like adhering to best practices or aligning to specific regulatory requirements are new, but they are quite more prevalent now. As more and more customers start to look into them, we have seen some products that target those specific needs pop up.
Now, despite what the marketing/sales folks will tell you, the whole “configuration as a code” thingy is not that new, even for Microsoft 365. In fact, Microsoft 365 DSC, an open-source project that leverages PowerShell’s desired state configuration for managing M365 resources, has been around since 2019. Commercial tools, such as CoreView’s Configuration Manager, have also gained some traction. As such, it is not surprising that Microsoft is now pursuing an officially supported (and as you can expect, paid) tool to do the same.
Meet Unified Tenant Configuration Management aka UTCM! Before we dive in few things need to be made abundantly clear, starting from the fact that this release is indeed a preview. Next, UTCM represents not only a building block of a new product Microsoft intends to release later this year, but it is also a platform on top of which customers and ISVs can build their own solutions. As such, it is no surprise to see the API-first approach taken with this preview, so be warned we will be looking at a bunch of code, and not any flashy UI.
Introduction and prerequisites
In a nutshell, UTCM is an officially supported version of Microsoft 365 DSC. In other words, it is a tool that allows you to get the configuration of your Microsoft 365 tenant(s) at a point in time, detect any deviations from a predefined baseline or any previous state, and eventually, run a remediation to bring the state back in order. All of this can be done programmatically in a structured and predictable manner, or in other words, can be fully automated. That said, the current preview includes only the snapshot, monitoring and configuration drift bits (all covered below), and does not allow for automated remediation.
The above description should already be alarming you to the potential impact a tool like UTCM can have on your tenant, so it is no surprise that it comes with some prerequisites and lots of warnings. Microsoft has chosen an approach that requires us to manually assign the set of required permissions, which will depend on the set of resources you plan to monitor, instead of pre-approving what would otherwise be a prohibitive set of scoped on the corresponding service principal.
Speaking of which, before you can try the UTCM preview, you must manually provision the service principal it uses. This will get automated once the tool hits GA, and the permission management itself will be handled via the UI. For the preview, you can use the following Graph SDK for PowerShell cmdlet to provision the required service principal object:
Connect-MgGraph -Scopes 'Application.ReadWrite.All'
New-MgServicePrincipal -AppId '03b07b79-c5bc-4b5e-9bfa-13acf4a99998'
where 03b07b79-c5bc-4b5e-9bfa-13acf4a99998 is the AppID of the Unified Tenant Configuration Management first-party application that the tool leverages. You can of course also use the Graph API for this step if you prefer.
This step will provision the SP object, but does not grant it any permissions to access resources within your organization. For that part, some additional work will be needed. To adhere to the principal of least privileges, it is strongly advised to outline the set of resources you plan to monitor and only grant the minimal set of permissions required to cover them. For example, if you plan to monitor Entra’s Conditional Access policies, the Policy.Read.All scope should do.
One important thing to note here is that whenever the UTCM service principal is discussed, any permission reference applies to application permissions. Any “backend” processes will rely on said service principal and the permissions we’ve granted to it, without any user element involved. In the example above the Policy.Read.All scope must be granted as an AppRole via the corresponding cmdlet/endpoint. You can refer to the official documentation for examples on how to do that.
Apart from the permissions stamped on the UTCM service principal, which as explained above are responsible for “backend” operations, two scopes can be used to designate users (or apps) that will be able to administer the feature. We have the read-only ConfigurationMonitoring.Read.All scope, and the read-write ConfigurationMonitoring.ReadWrite.All one. Those are available in both delegate and application permissions flavor. For the former, the user will also need an admin role in order to be able to work with UTCM. Currently, any of the Entra ID roles stamped with the privileged tag are supported.
In effect, we have a clear separation between the administrative tasks, which can be performed either as an admin user or as an application, at the backend tasks, which always run in the context of the UTCM service principal. Unless otherwise stated, all of the examples below are executed via the Graph explorer tool, thus are leveraging the delegate permissions model.
Monitoring functionality
Now that we have some idea what the tool does and how to get it running, let’s examine some basic scenarios. It goes without saying that the tool covers a lot more than we can go over in this short article, so make sure to also check out the examples in in the official documentation.
The basic building block for UTCM is the “monitor”. A monitor (or configurationMonitor object) is a scheduled task of sorts, which runs periodically in your tenant and collects data for the specified resource(s). The set of resources specified as part of the monitoring configuration represent its baseline, packaged as a configurationBaseline object, or in other words, a JSON blob. The baseline and the displayName are the only required properties when creating a new monitor, but it’s a very good idea to also add a detailed description.
Do note that not every Microsoft 365 resource is currently supported. For UTCM to be able to monitor a given resource, APIs or PowerShell cmdlets must exist already. While the team has been putting pressure on the different teams within Microsoft to ensure programmatic interfaces are available, we are still far away from complete coverage. Therefore, it is important that you go over the list of supported workloads and resources before deciding what your monitor(s) should cover.
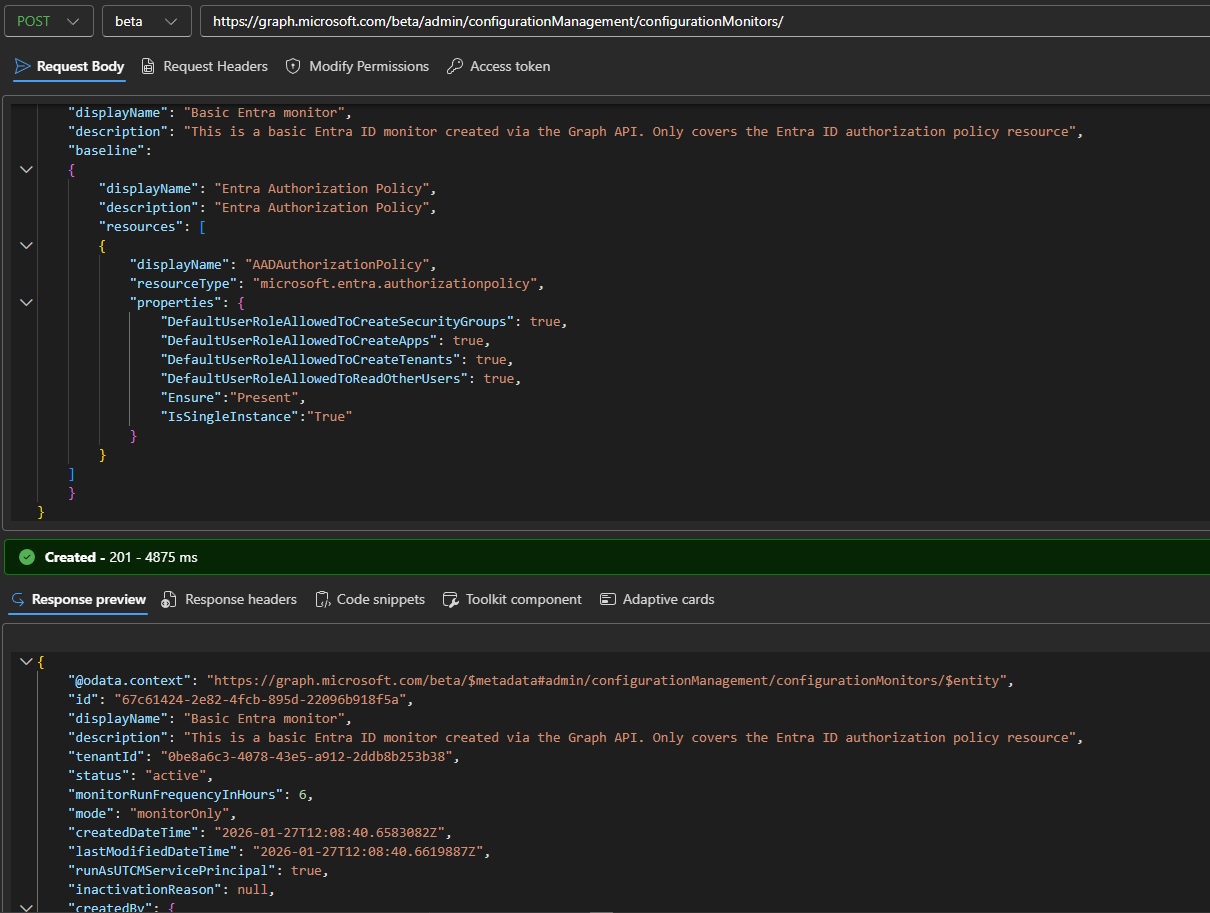
With the above in mind, here is an example of creating a new configuration monitor, by issuing a POST request against the /admin/configurationManagement/configurationMonitors endpoint. The resource we’ve chosen to cover is Entra’s authorization policy, represented by the microsoft.entra.authorizationpolicy resourceType value. We need to also include the properties that we want monitored, the list of which can be as narrow or as broad as you see fit. In addition the ensure special property is listed with value of Present, signaling that this is a resource that must exist at all times. Lastly, you’ll need to also specify the IsSingleInstance property, which is mandatory for Entra resources (not needed for ExO ones though).
POST https://graph.microsoft.com/beta/admin/configurationManagement/configurationMonitors/

{
    "displayName": "Basic Entra monitor",
    "description": "This is a basic Entra ID monitor created via the Graph API. Only covers the Entra ID authorization policy resource",
    "baseline":
    {
        "displayName": "Entra Authorization Policy",
        "description": "Entra Authorization Policy",
        "resources": [
        {
            "displayName": "AADAuthorizationPolicy",
            "resourceType": "microsoft.entra.authorizationpolicy",
            "properties": {
                "DefaultUserRoleAllowedToCreateSecurityGroups": true,
                "DefaultUserRoleAllowedToCreateApps": true,
                "DefaultUserRoleAllowedToCreateTenants": true,
                "DefaultUserRoleAllowedToReadOtherUsers": true,
                "Ensure":"Present",
                "IsSingleInstance":"True"
            }
        }
    ]
    }
}
 The GET/LIST, UPDATE and DELETE methods for the configurationMonitor resource work as one would expect, so we will just refer you to the examples in the official documentation for the sake of brevity. That said, few important properties do deserve a special mention. Post creation, each monitor object gets it Id, by which you can refer to it. It’ll also get stamped with the tenantId, as cross-tenant scenarios are the bread and butter of UTCM. The monitorRunFrequencyInHours property gives you the interval at which data collection occurs. Currently, you can’t modify the default 6 hour value, though Microsoft has committed to allowing some customizability in future releases.
The runAsUTCMServicePrincipal property will always be set to true, as monitors only run in the context of the UTCM service principal nowadays. As a result of that, the runningOnBehalfOf value should list the UTCM service principal (the one we provisioned as part of the prerequisites). Lastly, the baseline property details the resources/properties the current monitor covers. As baseline represents a relationship, you need to either use the $expand operator to include it within the output, or issue a standalone request via the Get baseline method.
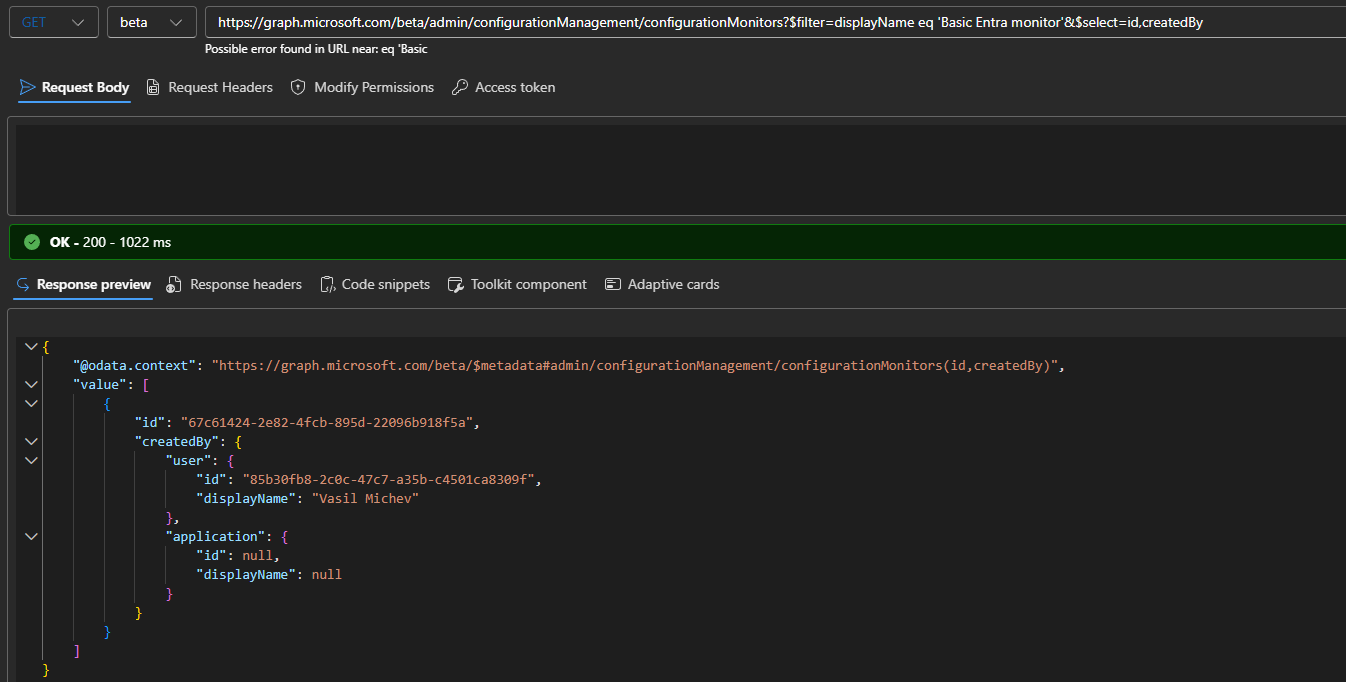
Since we mentioned the $expand operator, be aware that other standard Graph operators are also supported. Use the $filter operator to retrieve monitors matching specific criteria, $top to limit the result size and $select to fetch only properties you are interested in. Here’s an example on how to fetch monitors by name and return the creator metadata:
GET https://graph.microsoft.com/beta/admin/configurationManagement/configurationMonitors?$filter=displayName eq 'Basic Entra monitor'&$select=id,createdBy
As monitors execute, details on each run can be retrieved via the configurationMonitoringResult resource. Leverage the LIST method to fetch data for all runs, or the GET one for specific instances. The endpoint supports the standard Graph operators, so you can simply filter by the monitorId value. Use the $top operator to control the page size or follow the @odata.nextlink facet to get the full set of results (returned in pages of 10 by default).
GET https://graph.microsoft.com/beta/admin/configurationManagement/configurationMonitoringResults?$filter=monitorId eq '67c61424-2e82-4fcb-895d-22096b918f5a'
Within the output, you will get generic data about the monitor and tenant, the start and end time for the given run, its status and most importantly, the number of “drifts” encountered. Drift refers to a deviation from the desired state of a given object, such as its absence, or unmatching property values. But more on that in later sections.
The second article in this initial look at UTCM will cover working with snapshots and detecting configuration drift, as well as listing some of the limitations in the current preview.

1 thought on “Meet the supported version of Microsoft 365 DSC: UTCM quick look part 1”